Event Tracing for Windows (ETW)
ETW : A POWERFUL LOGGING MECHANISM
Hello friends, and welcome to a new blog!
In this blog, I’ve chosen to explain the intricacies of the Event Tracing for Windows (ETW) mechanism and how it contributes to Event monitoring and Real-Time Analysis.
OVERVIEW
ETW (Event Tracing for Windows) is a logging mechanism in the Windows operating system that manages the logging process. It is used in various IT fields, including software engineering profiling, threat detection, and analysis. Additionally, EDR agents utilize ETW to collect data from endpoints, enabling them to gather new data for creating alerts or enriching existing events.
ETW Components
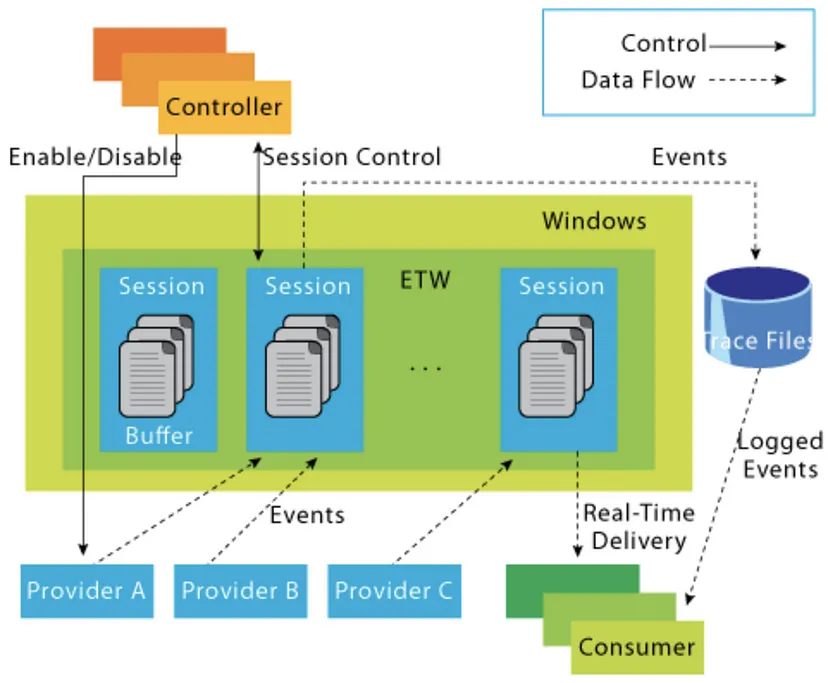
There are three main components involved in ETW: providers, consumers, and controllers. Each of these components serves a distinct purpose in an event-tracing session.
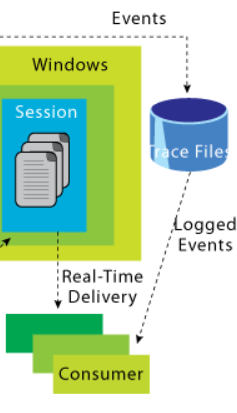
The image below describes the ETW Logging Mechanism and how all these components are integrated within it :
This seems complicated, but don’t worry; we will explain it carefully !
Let’s proceed with Providers :
Providers are the applications in the system that emit events such as Microsoft-Windows-Security-Auditing which is responsible for logging security-related events in the Windows operating system. This provider is a crucial component of Windows Security Auditing and plays a vital role in monitoring and maintaining the security of the system.
Providers have GUIDs that other software can use to identify them , for example the Microsoft-Windows-Security-Auditing has this GUID :
{54849625-5478-4994-a5ba-3e3b0328c30d}
In addition to that, we can check the provider GUID by navigating to the details section within Event Viewer in Windows
Furthermore, providers typically have more user-friendly names, most often defined in their manifest, which allow humans to identify them more easily. There are approximately 1,100 providers registered in default Windows 10 installations.”
Moreover, providers are securable objects, meaning that a security descriptor specifies who has permission to control the provider, subscribe to its events, and write events.
For instance, we will obtain the security descriptor of the WMI provider using an example from the ‘Evading EDR’ book :
1
2
3
4
5
PS > $SDs = Get-ItemProperty -Path HKLM:\System\CurrentControlSet\Control\WMI\Security
PS > $sddl = ([wmiclass]"Win32_SecurityDescriptorHelper").
>> BinarySDToSDDL($SDs.'0063715b-eeda-4007-9429-ad526f62696e').
>> SDDL
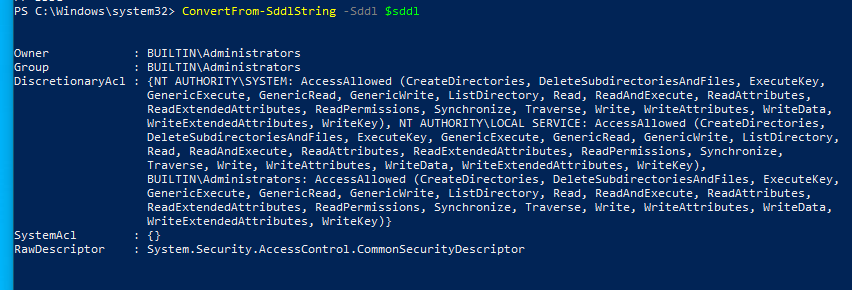
PS > ConvertFrom-SddlString -Sddl $sddl
The ouput :
As seen in this image, the security descriptor only allows access to NT AUTHORITY\SYSTEM, NT AUTHORITY\LOCAL SERVICE, and members of the local Administrators group. This means that controller code (we will explain the concept of controllers in the next part) must be running as an admin to directly interact with providers.
Additionally, there are various types of providers such as :
MOF providers , WPP providers , Manifest-based providers and TraceLogging providers
you can read about these types of providers via this link
After covering the fundamental concepts of ETW providers, let’s delve into Controllers.
Controllers, as the name implies, are applications responsible for initializing a trace session and managing the activation or deactivation of providers within that session.
To clarify further: a trace session is a live instance that gathers and logs trace events from one or more providers during runtime.
One of the frequently used ETW controllers is Logman, which enables starting, stopping, configuring, and managing the collection of trace events from diverse providers.
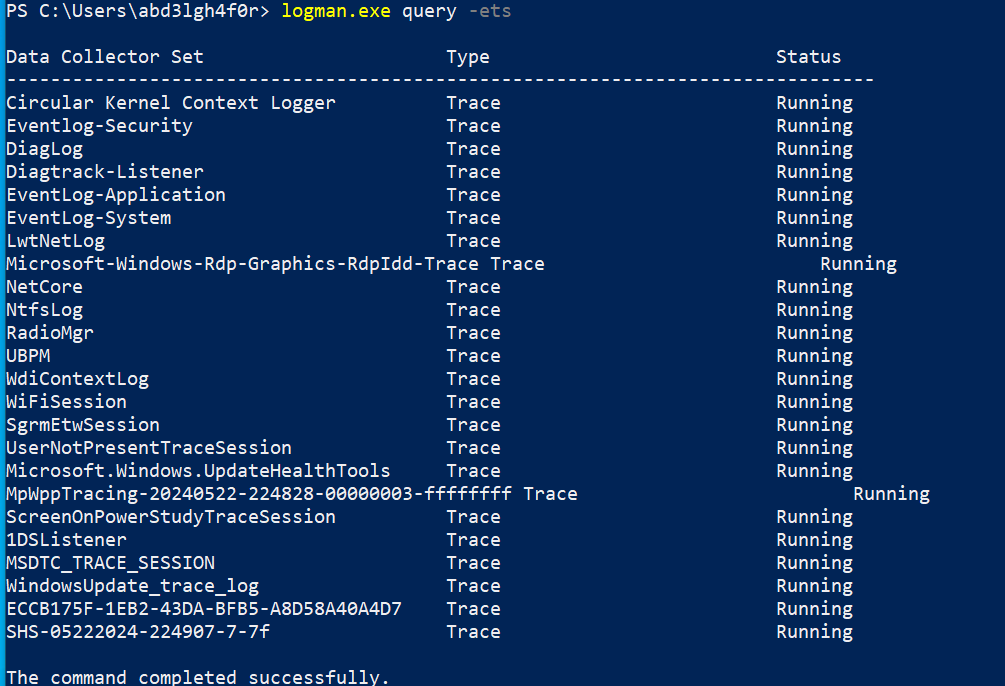
Using logman we can for example enumerate the existing trace session using this command :
1
 logman.exe query -ets
ets stands for : Event Trace Sessions
As depicted in this illustration, we have several active tracing sessions.
Additionally, we can obtain information about a particular ETS.
The ouput provides a comprehensive overview of the configuration and status of the 1DSListener Event Trace Session such as the events provider GUID , the Trace Information such as Buffer Size …
Let’s elaborate on Consumers.
Consumers are the software components that receive events after they’ve been recorded by a trace session. They can either read events from a logfile on disk or consume them in real time.
As illustrated in this image, consumers can either receive events in real-time or access them after they have been logged in file records
Windows provides various consumers, including the Windows Event Viewer, enabling users to observe and analyze a wide range of system events, including those produced by ETW providers.
Practical Example
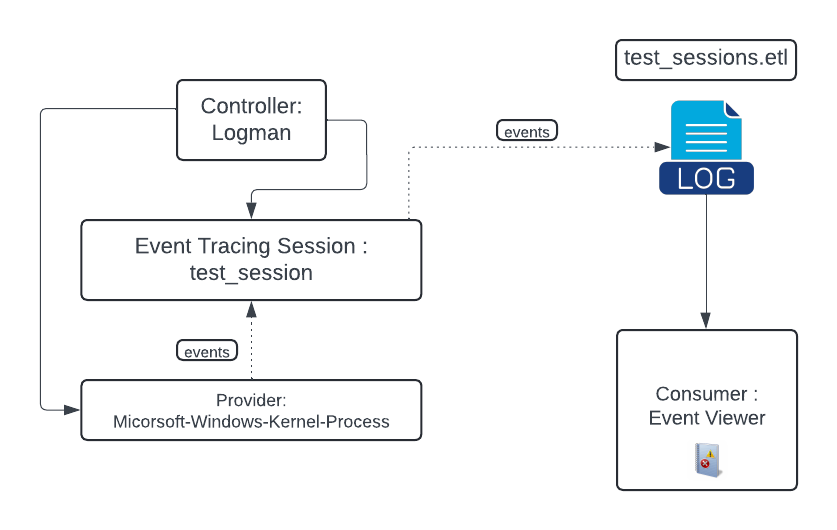
After explaining the fundamentals of ETW, we will conduct a practical example where we create an ETS and explore the generated logs within Event Viewer.
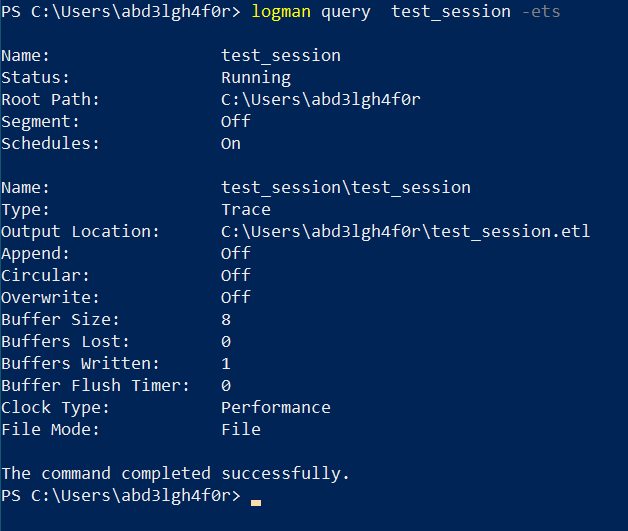
At first we create a tracing session :
Then we We register a provider to the tracing session :
And finally we open the file test_sesssion.etl using event viewer :
Reference1 : Evading EDR: The Definitive Guide to Defeating Endpoint Detection Systems
And with that, we come to the end of this article. Thank you for reading! Catch you in the next blog!
